

Introduction
Cricket, often dubbed a “gentleman’s game,” has evolved into a global phenomenon, uniting millions of fans across continents. At the heart of this sport lies the Cricket World Cup, a quadrennial event that showcases the pinnacle of One Day International (ODI) cricket. Since its inception in 1975, the World Cup finals have delivered iconic moments, fierce rivalries, and a window into the shifting dynamics of the sport. Using data from the List of Cricket World Cup Finals (1975–2023), this blog post dives into the trends, insights, and broader implications of these historic matches. From dominant teams to changing formats and growing global audiences, the story of the Cricket World Cup finals is not just about sport—it’s about culture, economics, and geopolitics. Whether you’re a business leader eyeing sponsorship opportunities, a policymaker fostering national pride, or a fan reliving epic battles, this analysis offers something for everyone.
Detailed Analysis
1. Dominance of Powerhouses and Emerging Underdogs
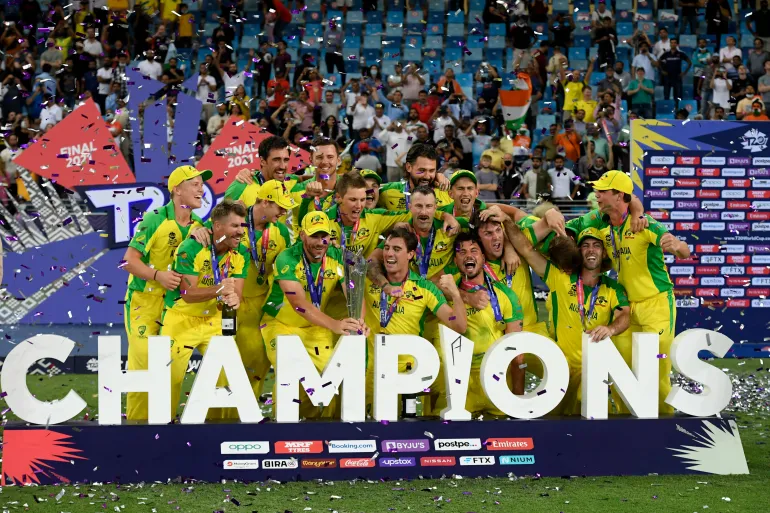
The dataset reveals a clear hierarchy among cricketing nations, with Australia emerging as the undisputed titan. With six titles (1987, 1999, 2003, 2007, 2015, 2023), Australia has won nearly half of the finals documented, showcasing a blend of tactical brilliance and raw talent. Their victories often came with commanding margins, such as the 125-run thrashing of India in 2003 at Johannesburg. This dominance highlights a well-oiled cricketing system, from grassroots development to high-performance coaching, offering a model for other nations.
However, the finals also tell a story of underdogs and surprises. India’s 1983 victory over the mighty West Indies—ending a 43-run upset at Lord’s—marked a turning point for cricket in the subcontinent, igniting a passion that transformed India into a cricketing powerhouse. Similarly, Sri Lanka’s 1996 triumph in Lahore, defeating Australia by 7 wickets, showcased the rise of non-traditional cricketing nations. These moments underscore the World Cup’s role as a stage for emerging talent, challenging the status quo and inspiring smaller nations to invest in the sport.
2. Evolution of Game Formats and Scoring Trends
The data reflects significant changes in the game’s format over nearly five decades. Early finals, such as those in 1975 and 1979, were played over 60 overs per side, with scores like West Indies’ 291/8 in 1975 considered mammoth. By 1987, the format shifted to 50 overs, aligning with modern ODI standards, and scoring patterns evolved. High-scoring encounters became more common, with Australia’s 359/2 in 2003 standing as a benchmark for batting dominance. Yet, tight contests persisted, as seen in the 2019 final where England and New Zealand tied at 241, with England clinching victory via a boundary countback—a controversial yet thrilling innovation.
This evolution mirrors broader trends in cricket, driven by aggressive batting, shorter formats like T20, and technological advancements in equipment. For business leaders, this signals a shift in fan expectations toward fast-paced, high-scoring games, influencing marketing strategies for sponsors like Prudential (early years) and the International Cricket Council (ICC) in recent decades.
3. Global Venues and Host Nations: A Cultural Showcase
The finals have been hosted across diverse geographies, from iconic venues like Lord’s in London (1975, 1979, 1983, 1999, 2019) to the colossal MCG in Melbourne (1992, 2015). Hosting rights have expanded beyond traditional powerhouses like England and Australia to include India, Pakistan, Sri Lanka, and even multi-nation collaborations (e.g., 2011 with India, Sri Lanka, and Bangladesh). This globalization reflects cricket’s growing footprint, with attendances soaring—95,000 at Eden Gardens in 1987 and 93,013 at MCG in 2015—demonstrating the sport’s mass appeal.
For policymakers, hosting a final offers a chance to boost tourism, infrastructure, and national pride. India’s 2023 final at the Narendra Modi Stadium in Ahmedabad, drawing 92,453 spectators, exemplifies how such events can elevate a country’s global image. However, challenges like logistical costs and security risks remain, especially for multi-nation events.
4. Risks and Challenges
While the data paints a picture of growth, it also hints at underlying risks. The dominance of a few teams—Australia, India, and West Indies account for most titles—raises concerns about competitive balance. Smaller nations struggle to break through, potentially alienating fans in emerging markets. Additionally, the 2019 tiebreak controversy highlights the need for fair and transparent rules, as fan dissatisfaction can erode trust in the sport’s governing bodies like the ICC.
Another risk lies in over-commercialization. As sponsors and broadcasters pour money into the game, ticket prices and accessibility for local fans may suffer, particularly in developing nations. Balancing profit with inclusivity will be critical for the sport’s long-term sustainability.
5. Opportunities for Growth
The Cricket World Cup finals data also points to immense opportunities. The sport’s expansion into new markets—evident from co-hosting by nations like Kenya (2003) and the Netherlands (1999)—suggests potential for grassroots investment. Business leaders can tap into this by sponsoring youth programs or regional tournaments, building brand loyalty in untapped demographics.
Moreover, technology offers a frontier for innovation. With streaming platforms and data analytics reshaping fan engagement, companies can leverage real-time insights to personalize experiences. For instance, analyzing scoring trends or crowd sizes (e.g., 87,182 at MCG in 1992) can guide targeted advertising during finals. Policymakers, meanwhile, can use cricket as a soft power tool, fostering international collaboration through joint hosting bids or cultural exchanges.
6. Memorable Moments and Emotional Resonance
Beyond numbers, the finals are a tapestry of human stories. The 1983 Indian victory inspired a generation, while the 2019 England-New Zealand thriller—decided by boundaries after a tie—reminded us of cricket’s unpredictability. These moments transcend sport, weaving into national narratives and personal memories, making the World Cup a cultural touchstone.
Conclusion
The Cricket World Cup finals, from 1975 to 2023, are more than a record of wins and losses—they are a mirror to the sport’s evolution and its global impact. Australia’s dominance, the rise of underdogs like India and Sri Lanka, and the shift to high-scoring, fan-centric formats reveal a game in constant flux. For business leaders, the finals offer a goldmine of sponsorship and engagement opportunities, while policymakers can harness the event’s cultural capital to drive tourism and unity. Yet, challenges like competitive imbalance and commercialization loom large, demanding careful stewardship from the ICC and stakeholders.
As we look to future tournaments, the data urges us to celebrate cricket’s diversity while addressing its disparities. Whether it’s nurturing talent in smaller nations or innovating for digital audiences, the Cricket World Cup remains a platform for inspiration and transformation. For fans worldwide, it’s a reminder that every final is a chapter in a larger story—one of grit, glory, and the unbreakable spirit of the game. Let’s await the next epic clash, knowing it will add yet another unforgettable page to cricket’s history.
From Lord’s to Ahmedabad: What 13 Cricket World Cup Finals Reveal About Winning on the Biggest Stage
A data story across five decades of ODI finals—dominance, venues, margins, and how champions actually win.
Quick Summary
- 13 finals analyzed across 1975–2023.
- 6 different champions; Australia leads with 6 titles.
- Finals decided by runs: 7; by wickets: 5.
- Most finals hosted: Lord’s, London with 5.
Introduction
Every men’s Cricket World Cup final is a pressure cooker where small decisions—the new‑ball lengths, a toss call under hazy lights, a risk in the powerplay—tilt one‑day history. To see what truly separates champions from nearly‑men, we compiled a clean dataset of all finals from 1975 through 2023. This story translates those scorecards into patterns any fan, selector, or sporting business leader can use to understand how titles are actually won.
The numbers cut through nostalgia. They show eras of dominance (West Indies went back‑to‑back in 1975 and 1979. Australia completed an unprecedented three‑peat in 1999, 2003, and 2007.), the gravitational pull of iconic venues (Lord’s hosted five finals), and a quiet truth about ODI cricket at the summit: when batting first sides post par‑plus, defences built on relentlessness, matchups, and catching tend to hold.
Summary Statistics
| Team | Titles | Runner_ups |
|---|---|---|
| Australia | 6 | 2 |
| West Indies | 2 | 1 |
| India | 2 | 2 |
| Pakistan | 1 | 1 |
| Sri Lanka | 1 | 2 |
| England | 1 | 3 |
| New Zealand | 0 | 2 |
Analysis & Insights
Who owns the podium?
Seven nations have appeared in World Cup finals, and Australia sit atop the mountain with 6 titles. England, the birthplace of the one‑day format, took longer to convert promise into silverware, finally breaking through in 2019 and finishing as runner‑up a record 3 times. India and the West Indies have two titles each—the Windies launching the competition with a swaggering two‑peat in 1975 and 1979, and India bookending eras in 1983 and 2011.
How are finals decided—by runs or by wickets?
Finals split cleanly into two styles of wins: chases that cross the line with wickets in hand, and defences where every dot ball turns the screw. In our sample, 7 finals were decided by runs (average margin around 51.3), while 5 were won by wickets (typical closing out near 6.8 wickets). Big‑stage nerves usually compress scoring; that makes early wickets and out‑fielding at least as valuable as late slogging.
Venues and the weather window
Five finals at Lord’s etched the ground into folklore, but the event’s footprint widened over time—from Lahore and Kolkata in the subcontinent’s dew‑laden evenings to Melbourne and Johannesburg with their big boundaries. Venue matters: square dimensions, pitch pace, and the weather window shape whether 240 is a knife fight or a platform. The move to multi‑nation hosting and colossal arenas—culminating in Ahmedabad in 2023—has amplified home crowds and the spectacle, but the underlying winning formula remains grounded in control under pressure.
Eras of dominance and the evolution of ODI risk
The West Indies of the late 1970s established pace intimidation as a tournament‑winning edge. The late‑1990s and 2000s saw Australia weaponize fielding and role clarity into a three‑peat. Modern sides stretch the field with 360‑degree batting and data‑driven matchups, but finals still reward patient accumulation, bowling to fields, and catching everything. Risk is selective, not showy.
What this means for coaches and analysts
- First‑innings par is contextual. Model par not from averages but from venue‑specific prior finals and knockout matches.
- Sharp fielding swings finals. In pressure games, saved 10–15 runs in the ring often outweight a late six.
- Phase planning beats vibes. Treat powerplays, middle overs, and death as distinct contests with micro‑targets and bowling plans.


Finals at a Glance
| Year | Winner | Runner-up | Winning margin | Venue | Host |
|---|---|---|---|---|---|
| 1975 | West Indies | Australia | 17 runs | Lord’s, London | England |
| 1979 | West Indies | England | 92 runs | Lord’s, London | England |
| 1983 | India | West Indies | 43 runs | Lord’s, London | England |
| 1987 | Australia | England | 7 runs | Eden Gardens, Kolkata | India, Pakistan |
| 1992 | Pakistan | England | 22 runs | MCG, Melbourne † | Australia, New Zealand |
| 1996 | Sri Lanka | Australia | 7 wickets | Gaddafi Stadium, Lahore † | Pakistan, India, Sri Lanka |
| 1999 | Australia | Pakistan | 8 wickets | Lord’s, London | England, Scotland, Ireland, Netherlands |
| 2003 | Australia | India | 125 runs | Wanderers, Johannesburg | South Africa, Zimbabwe, Kenya |
| 2007 | Australia | Sri Lanka | 53 runs ‡ | Kensington Oval, Barbados | West Indies |
| 2011 | India | Sri Lanka | 6 wickets | Wankhede Stadium, Mumbai † | India, Sri Lanka, Bangladesh |
| 2015 | Australia | New Zealand | 7 wickets | MCG, Melbourne † | Australia, New Zealand |
| 2019 | England | New Zealand | Tiebreak: 9 boundaries | Lord’s, London | England |
| 2023 | Australia | India | 6 wickets | Narendra Modi Stadium, Ahmedabad † | India |
Conclusion & Key Takeaways
- Control beats chaos: Finals reward pressure management, not just power‑hitting.
- Venue context is king: Model par and matchup plans to conditions; plan for dew and boundary sizes.
- Fielding is a title lever: In tight games, saved runs and clean catching decide trophies.