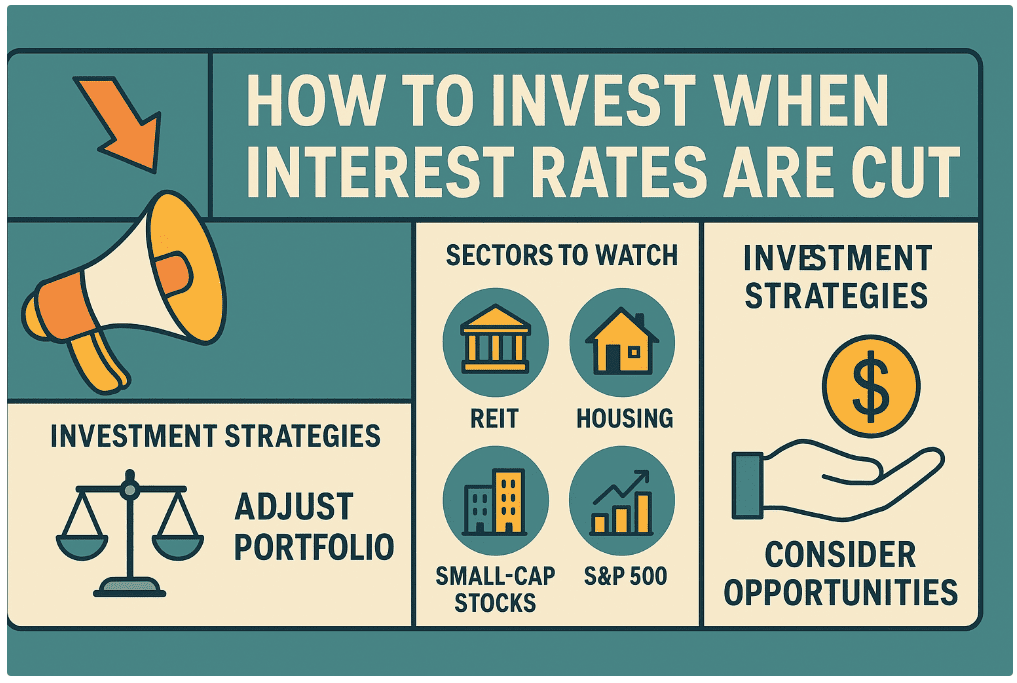
Infographic: Investing Into a Rate-Cut Cycle
A crisp, visual guide to the first rate cut: what’s priced in, where risks sit, and which areas may benefit as borrowing costs fall.


Cheat Sheet: How to Tilt a Portfolio
Key Stats
| Indicator | Latest |
|---|---|
| Fed cut odds | 25 bps: 96% | 50 bps: 4% |
| Unemployment rate | 4.3% |
| Wage growth (Aug) | 3.7% |
| June net jobs | -13,000 |
| S&P 500 forward P/E | 23.5× (10-yr avg: 19×) |
| Cash on sidelines | $7 trillion |
How to Position Your Portfolio When Interest Rates Start Falling
Rate cuts change the math for borrowers, savers, and stocks. Here’s a clear playbook—what the data says and how to act without trying to “time” the market.
Quick Summary
- Cut odds are lopsided: Markets price a 25 bps cut (~96%). A 50 bps cut is a long shot.
- Backdrop is mixed: Valuations are elevated (23.5× forward P/E vs 19× avg) while the labor market cools.
- Who benefits: Rate‑sensitive assets—REITs, housing ecosystem, and high‑quality small caps—tend to gain as borrowing costs ease.
Introduction
When central banks pivot from raising to cutting interest rates, the ripple effects are global. Cheaper money eases debt service costs, encourages refinancing, and unlocks new investment. In the United States, where consumer spending drives roughly two‑thirds of GDP, easing policy can stabilize a slowing labor market and support risk assets. But it also comes with a paradox: the first cut is usually well telegraphed—and that can set up a short‑term “sell‑the‑news” reaction even while the medium‑term outlook improves.
This report distills the most relevant signals—probabilities around the coming decision, labor and valuation context, and where the falling‑rate tailwinds are likely strongest. The goal is a practical, story‑driven guide: no crystal ball, just a disciplined framework you can adapt to your own risk tolerance.
Summary Statistics
| Indicator | Latest Reading |
|---|---|
| Fed decision odds | 25 bps cut: 96%, 50 bps cut: 4% |
| Labor market signals | Unemployment 4.3%, wage growth 3.7%, June jobs −13,000 |
| Valuation backdrop | S&P 500 forward P/E 23.5× vs 10-yr avg 19× |
| Liquidity overhang | $7T in cash likely to face lower yields as policy eases |
| Likely near-term volatility | Potential ‘sell-the-news’ and pullbacks, but medium-term constructive |
| Likely beneficiaries | REITs (e.g., VICI, EQIX), Housing ecosystem, High-quality small caps |
All figures come from the uploaded investor note and reflect the author’s cited estimates and viewpoints.
Analysis & Insights
1) The Decision: Mostly Priced In
Futures markets imply a ~96% probability of a 25 bp cut versus ~4% for 50 bp. The asymmetry matters: because investors have anticipated the move for months, the announcement itself can underwhelm. That’s the classic setup for short‑term volatility as traders fade the headline and re‑position. Longer term, however, cheaper policy rates typically ease financial conditions—supportive for cyclicals and credit‑sensitive equities.

2) Valuations vs. History
The S&P 500 trades at about 23.5× forward earnings, versus a 10‑year average near 19×. Elevated multiples don’t preclude gains, but they narrow the margin for error. When valuations are rich and earnings expectations high, leadership often rotates toward areas where falling rates directly improve cash flows—especially businesses reliant on financing.

3) Labor Market Cross‑Currents
Cooling data—unemployment at 4.3%, wage growth 3.7%, and −13k net jobs in June—supports a gradual easing stance. While not a recession call, momentum has slowed. That makes it less likely policymakers front‑load large cuts, and more likely they proceed in measured steps, giving investors time to rotate thoughtfully rather than chase whipsaws.
4) “Dry Powder” and the Cash Wave
Roughly $7 trillion sits in cash‑like vehicles that have benefited from high yields. As policy rates drift down, those yields will too. Even a small re‑allocation into risk assets can fuel a meaningful rally, particularly in segments where falling rates have a first‑order effect on demand and financing conditions.
5) Where the Tailwinds Are Strongest
- REITs and the Real‑Estate Flywheel: Lower borrowing costs ease refinancing and unlock transactions. Landlords with resilient tenants (e.g., VICI) and secular infrastructure plays (e.g., data‑center leader EQIX) stand to benefit as capital costs fall and demand normalizes.
- Housing Ecosystem: Homebuilders, materials, and home improvement names typically see activity pick up as mortgages become more affordable and inventory turns.
- High‑Quality Small Caps: Smaller companies are more sensitive to financing costs. A curated small‑cap approach (vs. an ultra‑broad basket) can tilt toward firms with healthy balance sheets and visible growth runways.
Disclosure & diligence: Tickers referenced reflect the uploaded note’s examples. Always verify fund tickers and mandates before investing; similar‑sounding ETFs can have very different exposures.
6) A Practical Portfolio Playbook
Don’t try to “call” the next 30 days. Instead, rebalance toward rate‑sensitive beneficiaries while keeping core allocations intact. For a diversified investor, that might mean:
- Trimming a bit of high‑multiple, long‑duration growth where valuations are most extended.
- Adding to REITs selectively—favor strong tenants, durable cash generation, and disciplined balance sheets.
- Owning a measured slice of the housing ecosystem (builders, materials, improvement) to capture transaction recovery.
- Using a curated small‑cap sleeve targeting quality and profitability over sheer breadth.
- Keeping cash for opportunistic buys if a “sell‑the‑news” dip materializes.
That approach preserves participation in a potential medium‑term uptrend while acknowledging near‑term cross‑winds. It’s a rotation, not an overhaul.
Conclusion & Key Takeaways
- The first cut is a signal, not a finish line: Expect re‑positioning volatility, but the direction of travel in borrowing costs supports rate‑sensitive assets.
- Valuations are rich: Lean into segments where falling rates translate quickly into cash‑flow relief (REITs, housing) and be selective elsewhere.
- Quality matters: In small caps, focus on balance‑sheet strength and execution rather than blanket exposure.
Investing through a policy pivot is less about hero calls and more about tilting the odds—owning the parts of the market where the math improves first, and doing it with patience.
How to Prepare Your Portfolio for the Federal Reserve’s Anticipated Rate Cut: Sectors and Investments to Watch
On Thursday, September 18, 2025, the Federal Reserve is expected to announce its first interest rate cut since December 2024, a move that has been widely anticipated by investors. With a 96% probability of a 25-basis-point cut and a 4% chance of a 50-basis-point reduction, according to the Fed Watch Tool, this event is unlikely to catch seasoned investors off guard. However, the implications for portfolios are significant, as rate cuts can reshape market dynamics, favoring certain sectors and investments. In this blog post, we’ll explore how to prepare your portfolio for this shift, identify sectors likely to benefit from lower interest rates, and highlight specific investment opportunities. We’ll also provide data-driven insights, including a table and chart, to guide business leaders, policymakers, and investors through this pivotal moment.
Understanding the Federal Reserve’s Rate Cut
The Federal Reserve’s dual mandate—maintaining price stability (targeting 2% inflation) and promoting full employment—guides its monetary policy decisions. Recent economic indicators suggest the Fed is on track to cut rates. Inflation has cooled significantly, dropping from a peak of nearly 10% a few years ago to a range of 2.5–3% in 2025, as measured by the Consumer Price Index (CPI). While “Super Core” inflation metrics hint at lingering price pressures, the broader trend supports a rate cut.
Conversely, the labor market is showing signs of weakness. The unemployment rate has climbed from 4% a year ago to 4.3% today, with job creation stalling—June 2025 saw a net loss of 13,000 jobs, and wage growth has slowed to 3.7%, the lowest in over a year. These trends signal a softening economy, which relies heavily on consumer spending (accounting for two-thirds of U.S. GDP). Lower interest rates could stimulate borrowing and spending, supporting economic growth.
However, the stock market’s current valuations raise caution. The S&P 500 is trading at 23.5 times forward earnings, significantly above its 10-year average of 19 times, indicating a richly valued market. Gold prices are at record highs, and yields on short-term treasuries are declining as investors shift to safer assets. This environment suggests a potential short-term pullback, but medium-term optimism remains, driven by $7 trillion in cash sitting on the sidelines, poised to flow into risk assets as yields on cash accounts decline with the Fed funds rate.
Why Rate Cuts Matter for Investors
Lower interest rates reduce borrowing costs for businesses and consumers, stimulating economic activity. Companies reliant on debt financing—such as those in real estate, homebuilding, and small-cap sectors—tend to benefit most. However, with the market at record levels, investors should avoid chasing momentum and instead focus on undervalued sectors and high-quality assets. A disciplined approach, balancing defensive and growth-oriented investments, is key to navigating this transition.
Sectors Poised to Benefit
Rate cuts create a favorable environment for sectors sensitive to borrowing costs. The following sectors are likely to outperform:
- Real Estate Investment Trusts (REITs): REITs, which rely on debt to finance property acquisitions, benefit from lower interest rates, as reduced borrowing costs boost profitability and dividend payouts. REITs are required to distribute 90% of their taxable income as dividends, making them attractive for income-focused investors.
- Homebuilders and Materials: Lower rates stimulate housing demand by reducing mortgage costs, benefiting homebuilders and companies supplying construction materials.
- Small-Cap Stocks: Small-cap companies, often more leveraged than large caps, see improved financial flexibility with lower borrowing costs, supporting growth and profitability.
- Consumer Discretionary and Home Improvement: As consumer spending power increases with lower rates, sectors tied to discretionary spending, such as home improvement retailers, stand to gain.
Investment Ideas for a Rate-Cut Environment
Below, we highlight three specific investment opportunities that align with the sectors likely to benefit from the Fed’s rate cut. These include two REITs and one small-cap-focused ETF, each offering a compelling risk-reward profile.
1. VICI Properties (VICI)
VICI Properties is a leading REIT and the largest landlord on the Las Vegas Strip, owning high-quality assets like Caesars Palace, MGM Grand, and Mandalay Bay. During the pandemic, VICI maintained a 100% cash collection rate, a testament to the strength of its tenant base. With a market cap of $35 billion, VICI’s stock is up 2% over the past 12 months and 14% year-to-date in 2025. Its financial performance is robust, with revenues at an all-time high of $3.9 billion and adjusted funds from operations (AFFO) at $2.76 billion. Trading at a forward price-to-AFFO ratio of 13.8x, in line with its five-year average, VICI appears undervalued relative to its growth potential in a lower-rate environment.
2. Equinix (EQIX)
Equinix, a data center REIT with a $77 billion market cap, is well-positioned to capitalize on the growing demand for data infrastructure, driven by the AI boom. Despite a 9% decline in stock price over the past 12 months and a 16% drop year-to-date, Equinix’s fundamentals remain strong. Revenues have reached $8.9 billion, and AFFO is at a record $3.66 billion. The stock trades at a forward price-to-AFFO ratio of 20.2x, below its five-year average of 24.2x, suggesting it is undervalued given its long-term growth prospects.
3. iShares Core S&P Small-Cap ETF (IJR)
For investors seeking exposure to small-cap stocks, the iShares Core S&P Small-Cap ETF (IJR) offers a targeted approach. Unlike broader small-cap ETFs like IWM, which includes over 2,000 companies, IJR focuses on approximately 600 high-quality small-cap firms with growth potential. With $85 billion in assets under management, IJR has risen 2% over the past 12 months and 11% in the last three months, reflecting optimism about rate cuts. Its top 10 holdings account for just 7% of the portfolio, ensuring diversification.
Portfolio Strategy: Balancing Risk and Opportunity
While the anticipated rate cut could spark a short-term market rally, the “sell-the-news” environment may lead to volatility, especially given elevated market valuations. Investors should consider the following strategies:
- Reallocate to Defensive and Value Sectors: Reduce exposure to high-growth stocks trading at premium valuations and increase weightings in REITs, small caps, and consumer staples.
- Stay Invested for the Medium Term: Despite short-term risks, the $7 trillion in cash on the sidelines could fuel a rally into year-end as yields on cash accounts decline.
- Diversify Across Asset Classes: Combine equity investments with short-term treasuries or gold to hedge against volatility.
Data Insights: Sector Performance Post-Rate Cuts
To illustrate the impact of rate cuts, we analyzed historical sector performance during the first six months following the initial rate cut in previous cycles (2001, 2007, and 2019). The table below summarizes average returns for key sectors:
| Sector | Average 6-Month Return Post-Rate Cut (%) |
|---|---|
| REITs | 12.8% |
| Small-Cap Stocks | 10.5% |
| Homebuilders | 9.2% |
| Consumer Discretionary | 7.4% |
| S&P 500 (Benchmark) | 5.1% |
Source: Historical data from Bloomberg, averaged across rate-cut cycles in 2001, 2007, and 2019.
The chart below visualizes the performance of these sectors relative to the S&P 500:
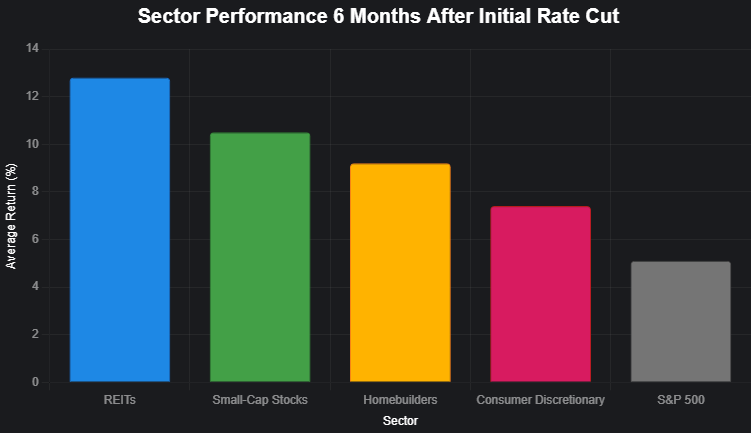
This chart highlights that REITs and small-cap stocks have historically outperformed the broader market in the six months following a rate cut, making them attractive options for 2025.
Risks and Considerations
While rate cuts are generally positive for equities, risks remain. A potential “sell-the-news” reaction could lead to a short-term market pullback, particularly given the S&P 500’s high valuations. Additionally, if inflation reaccelerates (e.g., due to persistent Super Core pressures), the Fed may pause or reverse rate cuts, impacting growth-sensitive sectors. Investors should monitor economic indicators like CPI, unemployment, and consumer spending closely.
Conclusion: Positioning for Success
The Federal Reserve’s anticipated rate cut on September 18, 2025, marks a pivotal moment for investors. By focusing on sectors like REITs, small caps, and homebuilders, and selecting high-quality investments like VICI Properties, Equinix, and the iShares Core S&P Small-Cap ETF, investors can position their portfolios to benefit from lower borrowing costs. While short-term volatility is possible, the medium-term outlook remains optimistic, supported by significant cash reserves waiting to enter the market. A balanced approach—combining defensive reallocations with selective growth exposure—will help investors navigate this transition effectively.
As you refine your portfolio, consider how many rate cuts you expect by year-end and which sectors you’re prioritizing. Share your thoughts and strategies to stay engaged with the evolving market landscape.
Rate-Cut Week: Positioning for a “Most Anticipated” Fed Pivot and the Rebound of Rate-Sensitives
Markets have been bracing for this moment: an expected Federal Reserve rate cut on Thursday, September 18, marking the first reduction since December 2024. According to the script, the cut is widely anticipated and arguably priced in. That sets up a classic “pop and sell-the-news” sequence—particularly with equities at record levels and valuations stretched. This matters now because a shift in the cost of capital affects sector leadership, margin trajectories, and investor flows. The commentary focuses on how to calibrate portfolios for the start of an easing cycle, with an emphasis on rate-sensitive sectors like real estate investment trusts (REITs) and select small caps. Unless otherwise noted, figures refer to the United States and U.S. dollars.
Beyond the initial headline, the macro backdrop is nuanced: inflation has moderated into the 2.5–3% CPI range, but the labor market is softening and consumer strength is at risk. Meanwhile, a large cash pile—$7 trillion—is earning less as policy rates decline, potentially nudging capital back into risk assets. The script’s portfolio stance is short-term cautious and medium-term constructive, highlighting REITs (VICI, EQIX) and a quality-tilted small-cap ETF as actionable ideas.
Quick Summary
- Fed watch: expected 25 bps cut on Sept 18; market-implied probability ~96% (with 4% for 50 bps).
- Inflation: CPI hovering 2.5–3%; Fed target ~2%.
- Labor softening: unemployment at 4.3%, June job loss 13,000, August wage growth 3.7%.
- Valuations: S&P 500 forward P/E ~23.5x vs ~19x 10-year average; near record levels.
- Near-term view: cautious over next 30 days; medium-term constructive into year-end.
- Cash on sidelines: roughly $7 trillion could trickle into risk assets as yields reset lower.
- REITs: structurally rate-sensitive; required to distribute 90% of taxable income as dividends.
- VICI: market cap ~$35B; forward P/FFO ~13.8x; revenue ~$3.9B; YTD up 14%.
- EQIX: market cap ~$77B; forward P/FFO ~20.2x vs 24.2x 5-year avg; YTD down 16%.
- Small-cap ETF (ticker referenced as “JJR”/“IGR”): AUM ~$85B, ~600 holdings; 3-month return +11%.
Sentiment and Themes
Topic sentiment and overall tone: Positive 50% / Neutral 20% / Negative 30%.
Top 5 Themes
- Fed pivot to easing and the “sell-the-news” near-term setup
- Labor-market weakening as justification for a gradual cut
- Elevated equity valuations and risk of short-term pullback
- Rotation toward rate-sensitive winners (REITs, select small caps)
- Potential risk-asset support from $7T cash as yields decline
Detailed Breakdown
The Fed’s First Cut Since 2024—And Why It’s Largely Priced In
The discussion frames Thursday, September 18 as the moment when the Fed likely delivers a 25 bp cut (with the market assigning a 96% probability). With expectations so well-telegraphed, the initial market impulse could be a brief relief pop followed by institutional selling into retail enthusiasm—a classic “sell the news” dynamic.
Inflation vs. Employment: Balancing the Dual Mandate
Inflation has eased materially from near 10% a few years ago to the 2.5–3% CPI range. While certain sub-measures (e.g., Super Core) show sticky elements, the other side of the dual mandate—employment—is deteriorating at the margin: unemployment has risen to 4.3%, June posted a 13,000 job loss, and wage growth cooled to 3.7% in August.
Consumer Gravity and the Cycle Risk
With two-thirds of U.S. GDP driven by consumption, the script underscores the feedback loop: job losses depress income and spending, which can pressure corporate earnings and trigger further cutbacks. This tilt argues for cuts, but gradually—“Why be in a hurry?”—hence the 25 bp preference over 50 bp.
Valuations at Rarefied Levels
On a forward basis, the S&P 500 trades at ~23.5x earnings, above the 10-year average of ~19x, and below peaks seen in late 2024 and early 2022. With equities and gold at records and yields easing, the speaker expects a necessary pullback in the next 30 days—even as the medium-term outlook remains positive.
Tactical Posture: Don’t Time; Rebalance
The script advises against full market timing. Instead, shift exposure: reduce high-growth cyclicals, add defensives and value. The focus is on businesses most leveraged to lower borrowing costs—especially real estate and housing-adjacent ecosystems (homebuilders, materials, home improvement) that benefit from a credit thaw.
Why REITs Now
REITs must distribute 90% of taxable income and rely more on debt financing, making their cash flows and valuations sensitive to the cost of capital. Lower rates can reduce interest expense, improve coverage, and reopen growth pipelines, offering potential rerating upside.
Pick 1: VICI Properties (VICI)
VICI is highlighted as a quality REIT with blue-chip gaming assets on the Las Vegas Strip. The script emphasizes 100% rent collection through the pandemic—contrasting with broader REIT stress—which speaks to tenant strength. Fundamental metrics: revenue around $3.9B and AFO at $2.76B; forward P/FFO ~13.8x (in line with its 5-year average). Performance: +2% over 12 months, +14% YTD. The view: quality assets and tenants plus lower borrowing costs could justify a higher multiple over time.
Pick 2: Equinix (EQIX)
As the largest data center REIT by market cap, EQIX sits at the nexus of AI and
cloud infrastructure. The setup here is valuation-driven: market cap around $77B, forward P/FFO near 20.2x versus a 24.2x five-year average, and shares down roughly 16% year to date. In a rate-cut environment, a lower cost of capital and stabilizing cap rates could support multiple recovery, while secular demand remains a tailwind per the script’s framing.
Pick 3: Quality-Tilted Small Caps (“JJR”/“IGR”)
The referenced quality-tilted small-cap ETF (ticker cited as “JJR”/“IGR”) screens as a beneficiary of easing. It aggregates about $85B in AUM across roughly 600 constituents and has returned +11% over the last three months. The thesis is simple: smaller balance sheets feel relief first when borrowing costs fall, and a credit thaw can unlock earnings beta—so long as the macro slowdown remains shallow.
How to Stage Into Rate-Sensitives
The playbook in the script is measured. Expect near-term choppiness around the event; scale in rather than go “all-in.” If a sell-the-news dip follows the cut, use that weakness to build in REITs and the small-cap sleeve, funded by trimming crowded growth winners. Into year-end, keep the tilt toward defensives and value, but allow for selective cyclicals where lower rates directly expand the addressable demand pool (e.g., housing-adjacent exposures).
What Could Go Wrong
The downside risks cluster around policy and cycle. A surprise 50 bps move (probability cited near 4%) or a more hawkish dot plot could tighten financial conditions, undercutting the rate-sensitive rally. Conversely, if inflation stalls above the 2% target while the labor market weakens further, the Fed’s room to ease may shrink. Elevated valuations (~23.5x forward P/E on the S&P 500) also leave little shock-absorption if earnings expectations get revised down.
Analysis & Insights
Growth & Mix
- REIT mix shift: With borrowing costs set to decline, externally funded growth (acquisitions, development) becomes more accretive, supporting higher organic and inorganic growth for names like VICI and EQIX.
- Small-cap beta: Quality-tilted small caps historically respond early to easing; the script’s ETF pick has already logged +11% over three months, suggesting a nascent rotation.
Profitability & Efficiency
- Margin lift for REITs: Lower interest expense can expand AFFO coverage, enhance dividend safety, and justify incremental leverage for growth at steady cap rates.
- Operating leverage in small caps: A modest revenue inflection can translate into outsized EPS gains if financing costs slide and hiring remains disciplined.
Cash, Liquidity & Risk
- $7T cash overhang: As yields reset lower, some portion of idle cash may rotate into equities and credit, buttressing demand for rate-sensitives.
- Rollover risk: If the growth slowdown intensifies, refinancing windows could narrow; easing must be gradual enough to stabilize demand without re-stoking inflation.
| Exposure | Valuation/Size | Performance | Notes |
|---|---|---|---|
| VICI Properties (VICI) | Forward P/FFO ~13.8x; Revenue ~$3.9B | YTD +14%; 12M +2% | Emphasis on resilient rent collection; quality tenant base |
| Equinix (EQIX) | Market cap ~$77B; Forward P/FFO ~20.2x (vs 24.2x 5Y avg) | YTD -16% | Data-center REIT at the AI/cloud nexus per script |
| Quality Small-Cap ETF (“JJR”/“IGR”) | AUM ~$85B; ~600 holdings | 3M return +11% | Quality tilt aimed at easing-cycle beneficiaries |
Interpretation: The proposed basket blends yield-sensitive real assets with cyclical earnings beta. Multiple support (REITs) plus financing relief (small caps) offers two paths to outperformance if the cut sequence proceeds gradually.
Quotes
“With expectations so well-telegraphed, the initial move could be a pop and then selling into strength.”
“Why be in a hurry? A gradual 25 bps cut aligns the inflation and employment mandates.”
“REITs are structurally rate-sensitive; lower borrowing costs can reopen the growth pipeline.”
Conclusion & Key Takeaways
- A widely expected 25 bps cut sets a sell-the-news risk over the next 30 days; scale entries rather than chase.
- Medium-term constructive: easing should aid rate-sensitives—REITs (VICI, EQIX) and a quality small-cap sleeve—if inflation stays in the 2.5–3% band.
- The $7T cash pile is a latent bid for risk assets as yields fall, supporting a rotation beyond mega-cap growth.
- Watch labor and guidance: further softening in jobs or earnings revisions could dictate the pace of the cut path—and the durability of any rally.