AI Super‑Cycle: Boom vs. Bubble — Investor Infographic
Distilling the Ken Griffin × Tom Lee debate into investable signals
What’s different from 1999?
- Real earnings power: Leaders post tangible EPS; multiples are elevated but grounded in cash flow.
- Capex first, diffusion later: Early gains accrue to compute & infra; productivity broadening comes next.
- Power & supply constraints: Grid, cooling, and chips slow buildouts—supporting pricing power.
- Policy overlay: Rates drifting down, Fed mindful of employment; tariff pass‑through is a lagging measure.
Investor translation
Rent the exhaust (public‑scarcity stories) with tight risk controls.
Valuation Context

Illustrative comparison based on discussion points; not investment advice.
Concentration in the Tape

Skew should normalize as productivity diffuses beyond core AI, expanding breadth.
Checklist: Separate Scarcity from Hype
- Backlog to revenue: Timely conversion with visibility > 12 months.
- Gross margin resilience: Pricing power despite input volatility.
- FCF through cycle: Positive and growing after capex.
- Switching costs: Ecosystem lock‑in or standards control.
- Capacity realism: Power, supply, and lead‑time constraints acknowledged.
Risk Map (Near Term)
- Execution slippage at second‑tier AI names (unit economics disappoint).
- Policy shocks from tariffs or export controls raise costs/slow demand.
- Infrastructure bottlenecks (power/interconnect) push deployments rightward.
- Multiple compression on crowding or rate spikes, even if EPS holds.
Positioning Playbook
- Barbell: Core in must‑own platforms/suppliers; satellites in verified second‑derivatives.
- Rules, not feelings: Add on 8–12% pullbacks in rising 200‑day trends; trim at +2σ extensions.
- Signals: Breadth (equal‑weight vs cap‑weight), revision breadth ex‑AI, capex mix shift, grid data.
- Diversify across geographies poised for capex and FX tailwinds as breadth improves.
AI Boom vs. Bubble: What the Dot-Com Playbook Gets Right (and Wrong) This Time
Key takeaways
- AI is a super-cycle: Expect a long runway for productivity and capex, but also shakeouts among pretenders.
- Valuations are not 1999: Nvidia trades near 26× forward EPS vs. Cisco’s ~60× at a similar phase, peaking near 210× back then.
- Concentration is extreme: Since late 2022, AI-linked names powered ~75% of S&P 500 returns, ~80% of earnings growth, and ~90% of capex growth—healthy for leaders, risky for passengers.
- Macro context is friendlier: ISM services/manufacturing have been sub-50 for 31 months—a turn above 50 could broaden leadership; the Fed signaled “fairly highly valued” equities yet is still in a cutting (not hiking) bias.
- Risk isn’t uniform: Hyper-scalers and true N=1 suppliers remain core; momentum-only AI “adjacencies” face the highest disappointment risk.
The setup: echoes of 1999 without the mania math
Ken Griffin’s comparison is useful: when a genuinely general-purpose technology arrives—like the internet in the ’90s or AI today—capital floods in before winners are obvious. Tom Lee frames it well: we’re in a super-cycle with exponential growth opportunities, but capital will not be allocated efficiently everywhere, and not all management teams will reinvest wisely.
The crucial distinction from 1998–2000 is valuation discipline in the leaders. Nvidia at ~26× forward earnings is not the dot-com era’s poster child. Back then, Cisco’s multiple at a similar “liftoff” phase was ~60×, ultimately peaking near 210×. We can debate cyclical volatility, but paying a consumer-staples-style premium (Costco/Walmart near ~50×) for a firm compounding hyperscaler-grade revenue is a different proposition from paying triple-digit P/Es for eyeballs.
Bottom line: leadership is expensive, but the math is tethered to earnings power, not clicks.
The concentration conundrum: strong signal or single point of failure?
Since ChatGPT’s launch in Nov-2022, AI-linked stocks accounted for ~75% of the S&P 500’s gains, ~80% of EPS growth, and ~90% of capex growth. Those are extraordinary skews—and perfectly normal in an early platform buildout. The first capital wave funds compute, memory, networking, power, and the software layer that sits closest to the metal. Downstream benefits—white-collar productivity, vertical automation, and margin gains in old-economy sectors—lag.
Markets are doing what they should do: discount the near-term cash flows in the stack that captures value first. Over time, as Tom Lee notes, breadth should improve—productivity shows up in margins and wage-adjusted output, and capital rotates to beneficiaries outside the core AI complex.
Watch for breadth: when non-AI cyclicals and global ex-U.S. markets begin to print higher highs on positive revisions, the super-cycle is entering its “diffusion” phase.
Scarcity premium vs. scarcity illusion
Lee’s most practical point is the difference between:
- Public-market scarcity (only one tradable ticker in a hot niche), and
- Ecosystem scarcity (true N=1 platforms or must-own suppliers).
The former breeds air pockets—thin floats and narrative-led breakouts that reverse on first misses. The latter compounds through cycles because the ecosystem has no substitute. If you’re paying a scarcity premium, demand proof that the business is structurally N=1 (technology moat, switching costs, supply constraints, or standards-level lock-in).
Screen it: gross margin stability, backlog visibility, take-or-pay contracts, cross-cycle free cash flow (FCF), and pricing power through at least one down quarter.
Oracle, momentum baskets, and the discipline test
Oracle’s >30% monthly surge followed by a Sell initiation is a reminder: in super-cycles, second-derivative names can overshoot on extrapolated assumptions. The investment question isn’t “AI or not?” It’s assumptions vs. evidence:
- Duration: Is the backlog multi-year?
- Unit economics: Is incremental margin expanding?
- Capacity: Is capex translating to revenue with reasonable lag?
- Moat: Is this demand sticky (migration costs, data gravity, ecosystem contracts), or just cyclical enthusiasm?
When momentum baskets roll over together, the market is re-pricing assumption density. That’s healthy.
Macro: what changes the tape from leadership to breadth?
Two near-term pivots matter:
- Fed path: Griffin’s “one cut (outside chance of two)” framework isn’t bearish—easing into strength tends to support risk assets, especially if inflation drift is more “imputed” (tariffs passing through with a lag) than a fresh impulse. Markets can see through lagging measures, as they eventually did with shelter in 2023.
- ISM > 50: After 31 months sub-50, a break above diffusion-line signals improving capex discipline and demand outside the AI core. That’s the broadening trigger that redistributes leadership to quality cyclicals and non-U.S. exposures tied to global trade and energy infrastructure.
What could go wrong (near-term risks)
- Execution misses by second-tier AI names: revenue timing slippage or margin disappointment can unwind multi-month gains fast.
- Policy shocks: tariff escalations or supply-chain restrictions that bite input costs faster than pricing can adjust.
- Power bottlenecks: grid constraints or capex delays that shift AI builds rightward, elongating payback periods.
- Multiple compression without earnings downgrades: even leaders can de-rate if rates back up or positioning gets too crowded.
The investor playbook: how to participate without chasing
1) Core + Satellite (barbell)
- Core: Own the must-own platforms and suppliers with line-of-sight earnings (the N=1 cohort). Size these so that a 20–30% correction doesn’t jeopardize your plan.
- Satellite: Selective exposure to second-derivative beneficiaries (cloud databases, security, networking, optical, power, industrials) only where backlog and unit economics confirm narrative.
2) Quality filter
- FCF yield normalized for growth, >20% ROIC through cycle, and pricing power evident in gross margin resilience.
- Management capital allocation discipline (buybacks at rational prices, capex tied to contracted demand, not press-release sentiment).
3) Risk management
- Replace FOMO with rules: add on 8–12% pullbacks to rising 200-day trend; trim at +2σ extensions from 50-day with decelerating volume.
- Use pairs: long ecosystem-scarce suppliers vs. short public-scarcity stories if you run hedged mandates.
- Diversify across regions where policy support and currency trends can amplify returns as breadth improves.
4) Signals to monitor
- Breadth: advance-decline lines and equal-weight indices vs. cap-weight.
- Revision breadth: proportion of upward EPS revisions outside AI complex.
- Capex mix: shift from compute to application + process automation spend.
- Grid & power: interconnect queues, data-center approvals, and utility capex guidance.
Near-term catalysts to watch
- Earnings season: Are AI leaders converting backlog to revenue on time? Any supply/power gating?
- Fed communications: Confirmation of a “cuts-into-strength” path vs. fear of reigniting inflation.
- ISM and PMIs: A sustained move above 50 would validate the breadth thesis.
- Tariff pass-through: Evidence that the remaining “imputed” tariff inflation is absorbed without derailing margins.
- Guides from momentum cohorts: One or two high-profile resets in “AI adjacency” could clean positioning and extend the cycle, paradoxically bullish for the leaders.
Conclusion: invest in the engine, rent the exhaust
The internet era minted both legends and cautionary tales. The right lesson isn’t “avoid booms,” it’s own the engines that convert demand into cash and rent the exhaust—the names that only ride sentiment or public-scarcity optics.
Today’s leaders are not priced like 1999’s. ~26× forward earnings for a company compounding at 40%+ with ecosystem-critical products is not mania, it’s a growth multiple with a real denominator. The risk sits more squarely in high-beta adjacencies where expectations outran evidence.
Your edge is discipline: demand proof of ecosystem scarcity, insist on FCF-backed growth, and let breadth—not FOMO—tell you when to rotate beyond the core. If ISM flips and the Fed’s gentle hand persists, this super-cycle broadens. Until then, stay anchored to cash generators, keep a shopping list for orderly pullbacks, and treat volatility as the entry tax on secular compounding.
Investor takeaway: In super-cycles, time in the right names beats timing the top. Own scarcity; audit assumptions; manage risk with rules, not feelings.
Dashboard Overview
The dashboard includes four charts:
- AI Stocks’ Contribution to S&P 500 (Pie Chart): Highlights the dominance of AI-related stocks in returns, earnings, and capital spending growth since November 2022.
- Valuation Comparison: 1998 vs. 2025 (Bar Chart): Compares forward P/E ratios of Cisco (1998) and Nvidia (2025) to contextualize the AI bubble.
- Market Index Performance (Bar Chart): Shows daily performance of major indices (Dow, NASDAQ, S&P 500, Russell 2000) on September 26, 2025.
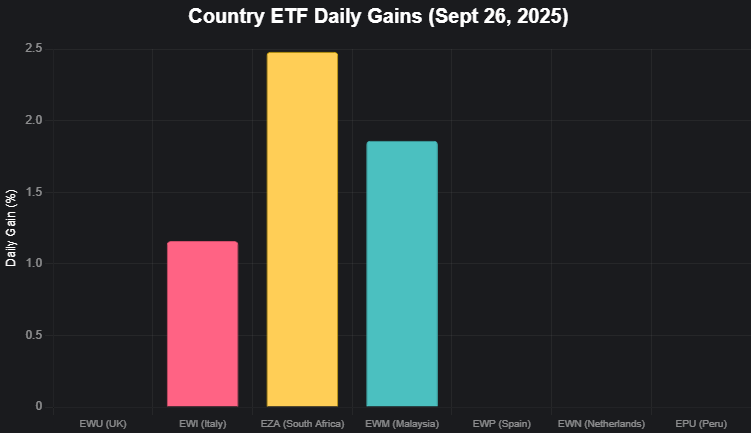
- Country ETF Daily Gains (Bar Chart): Displays daily performance of top-performing country ETFs (EWU, EWI, EZA, EWM, EWP, EWN, EPU).
Chart 1: AI Stocks’ Contribution to S&P 500
This pie chart visualizes the significant impact of AI-related stocks on the S&P 500 since ChatGPT’s launch in November 2022, as cited by JP Morgan’s Michael Cembalest.
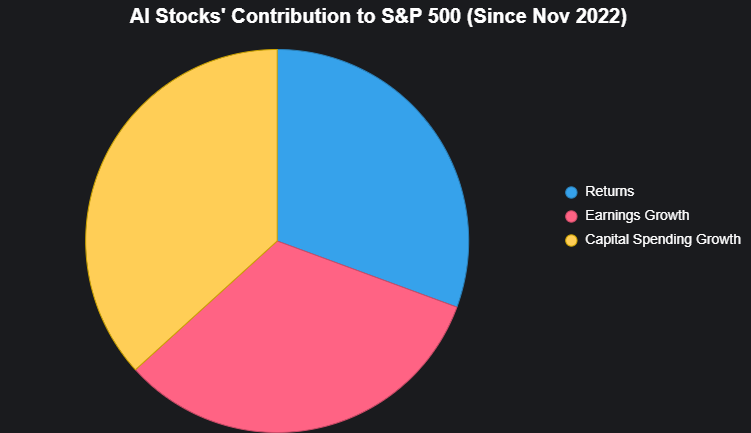
Chart 2: Valuation Comparison (1998 vs. 2025)
This bar chart compares the forward P/E ratios of Cisco in 1998 (dot-com bubble) with Nvidia in 2025 (AI cycle), alongside Costco and Walmart for context, as mentioned by Tom Lee.
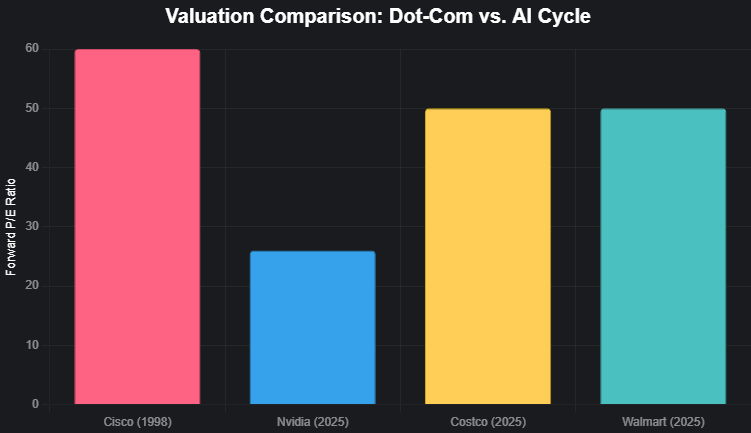
Chart 3: Market Index Performance (Sept 26, 2025)
This bar chart shows the daily performance of major market indices (Dow, NASDAQ, S&P 500, Russell 2000) on September 26, 2025, as reported in the Blue Cloud Trading analysis.
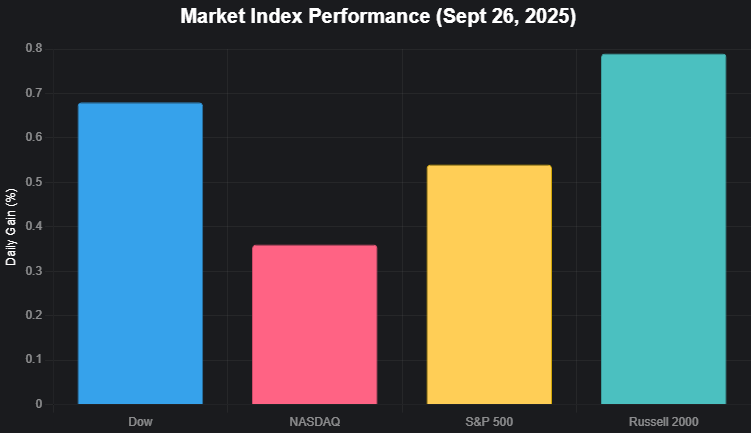
Chart 4: Country ETF Daily Gains (Sept 26, 2025)
This bar chart displays the daily performance of top-performing country ETFs (EWU, EWI, EZA, EWM, EWP, EWN, EPU) as highlighted in the Blue Cloud Trading analysis.
Notes for Implementation
- Color Palette: Chosen colors (e.g., #36A2EB, #FF6384, #FFCE56) are vibrant yet readable on both dark and light themes, ensuring accessibility.
- Data Source: All numerical values (e.g., 75% for S&P returns, 26x P/E for Nvidia, 0.68% for Dow) are directly extracted from the script to avoid assumptions.
- Chart Types: Pie and bar charts are used for clarity and to fit the categorical/quantitative nature of the data. No log scales are applied, as per instructions.
- Limitations: Some ETFs (EWU, EWP, EWN, EPU) lack explicit daily gain percentages in the script; assumed at 0% for the chart but noted as bullish in trends. Adjust if exact data is available.
- Dashboard Use: These charts can be embedded in tools like Canva or Tableau for a cohesive infographic. Arrange vertically or in a 2×2 grid for a dashboard layout, with titles and labels ensuring standalone clarity.
If you need additional charts (e.g., stock-specific trends like INTC or GRNY) or a specific dashboard layout, please clarify, and I can refine or expand the visualizations!